Introduction
Queue monitoring lets you inspect the source and target processing queues used by Data Sync. Use these pages when diagnosing delayed syncs, stuck messages, or processor errors.
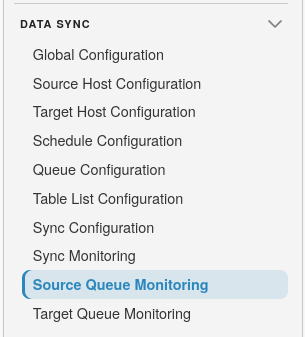
To reach these pages, open SQLSync from the landing page, then select Data Sync >> Source Queue Monitoring or Target Queue Monitoring:
Source Queue Monitoring
The source queue list shows queues that receive work for reading source tables (initial sync, deltas, checksums, and related actions).
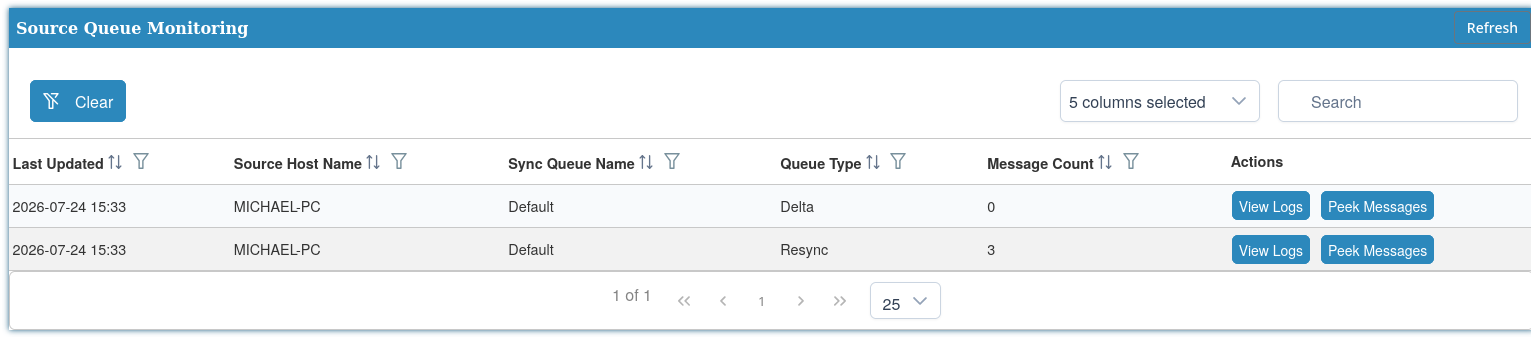
Use Refresh to reload the list. Message counts on the source and target queue lists update in realtime.
Row actions typically include:
- View Logs - open recent processor logs for the queue
- Peek Messages - inspect messages waiting on the queue
View logs
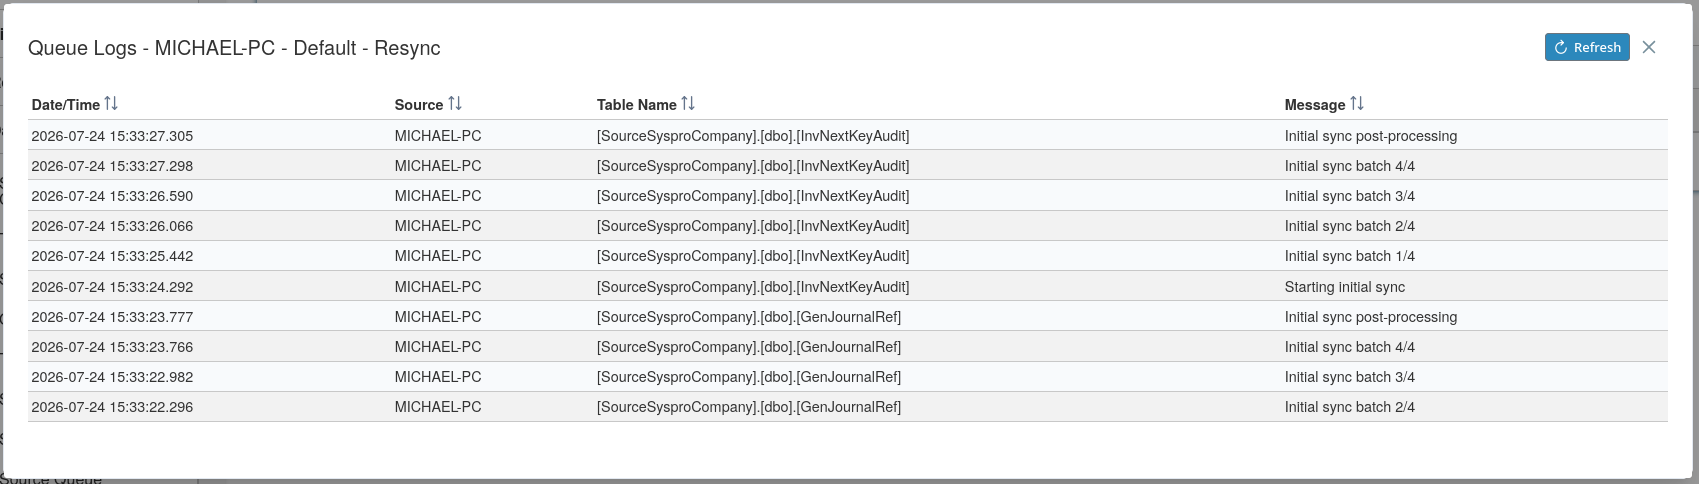
The dialog keeps the last 20 log messages. While a step is still running, a
Current step running for timer appears above the table (for example
2m 15s) together with the latest step message. Use Refresh in the dialog
to reload logs, or wait — the dialog also refreshes on its own while it is open.
Close the dialog when finished.
Peek messages
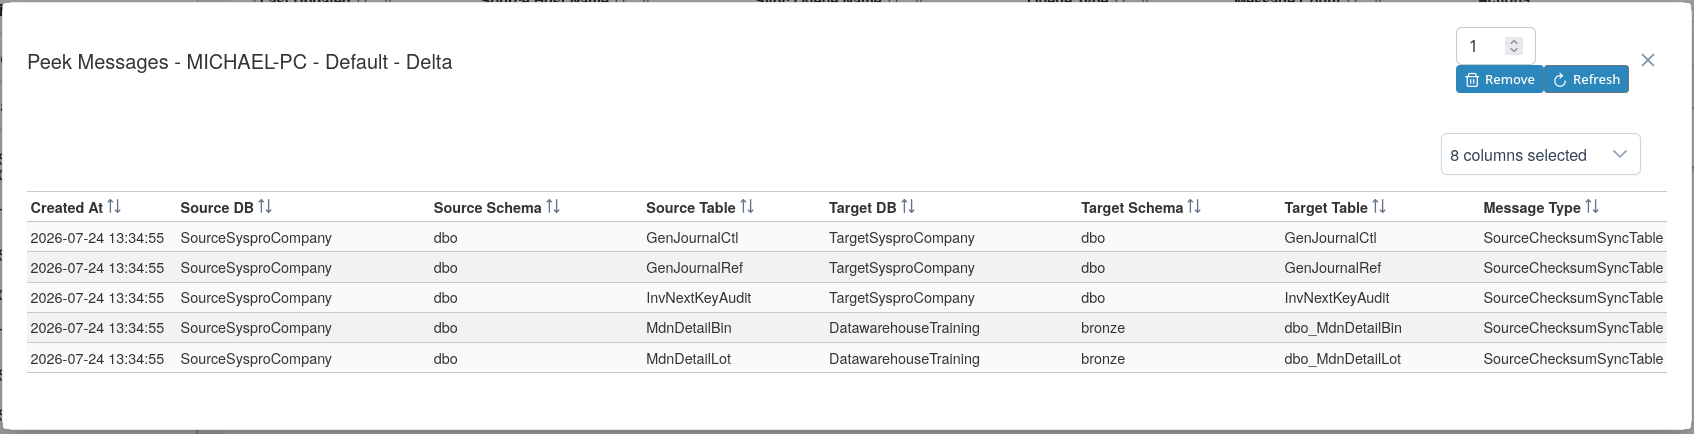
From the peek dialog you can:
- Review pending messages
- Enter a count and select Remove to discard that many messages from the front of the queue
- Refresh the peeked message list
SQLPro asks you to confirm before removing messages, for example: Are you sure you want to remove 3 messages from "Default"? This cannot be undone.
Warning
Removing messages discards queued work. Only remove messages when you understand the impact on pending sync operations.
Target Queue Monitoring
The target queue list shows queues that apply changes on Fabric or SQL Server targets.
Target peek views may include additional batch or insert/update/delete counts for the messages being applied.
It works in much the same way as Source Queue Monitoring
Tip
If monitoring shows tables stuck in pending or error states, check both source and target queues. Source issues often appear first when source instances are inaccessible; target issues appear when blob storage or target instances are inaccessible.